JUPITER IN 2004/05:
SECOND INTERIM REPORT, 2005 APRIL 11th.
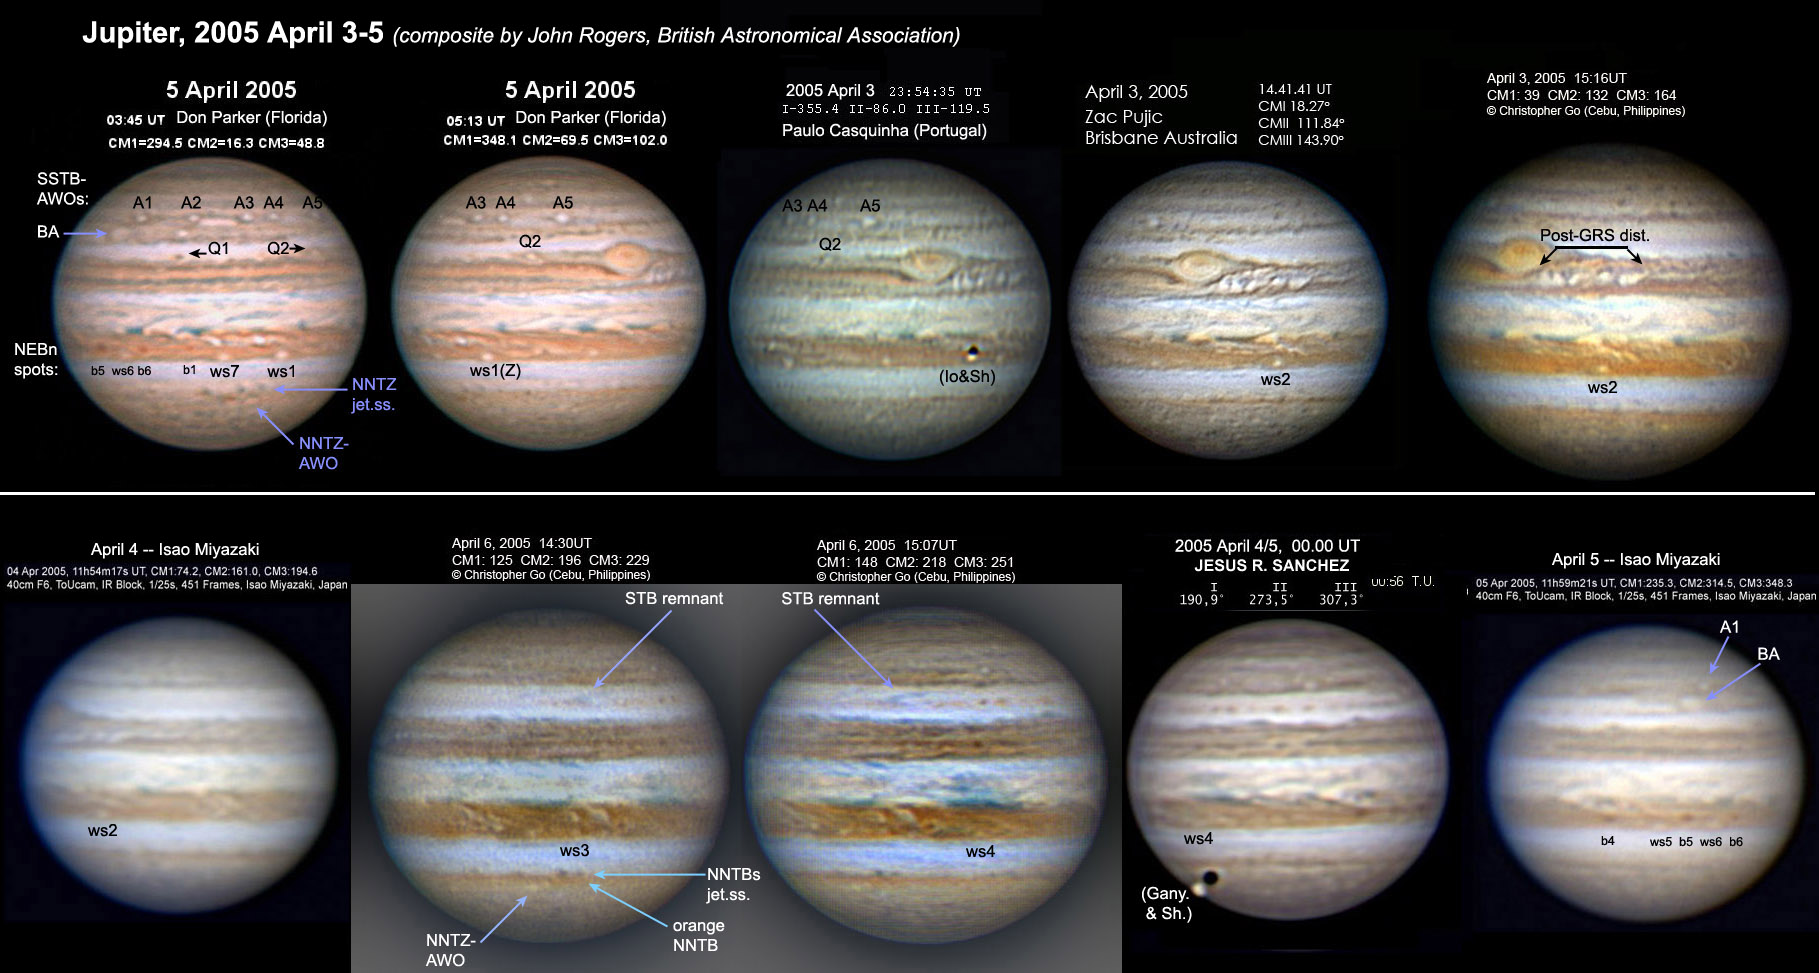
As opposition has now passed, here are some notes on some spots of
interest, on recent images and on the JUPOS charts released March 5. They
are marked on the attached montage of images from April 3-5, around the
date of opposition.
S.S. Temp. region: The long-lived chain of 5 anticyclonic white ovals
(AWOs) still exists, presently prograding past the GRS. The AWOs are
typically separated by cyclonic eddies, and two of these have become
notably bright, between A2-A3 and between A4-A5. The latter has been
present all apparition, but the one between A4-A5 only brightened in Feb.,
and seems to be expanding; this is typical of closed cyclonic
circulations.
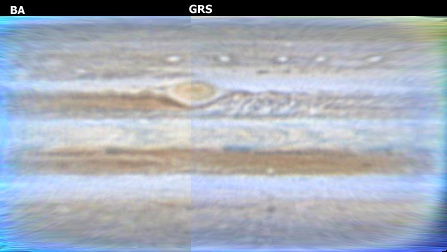
S.Temp. region: Oval BA is still large and well-defined. There is
only
one segment of dark STB, f. oval BA. The second segment which used to be
dark has been reduced to a faint oblique bluish streak, near L2 ~ 200.
S.Tropical Zone: In Feb., retrograding SEBs jetstream spots were
conspicuous and several entered the Red Spot Hollow. They are less
conspicuous now, but there are two notable dark spots in STropZ,
presumably anticyclonic, and nearly stationary (retrograding by only a few
degrees per month). One (labelled Q1, at L2 ~ 5) is very dark; the other
(labelled Q2, at L2 ~ 60) is a larger ring. In recent years spots like Q2
have often developed here, p. the GRS, intensifying as they interact with
SEBs jetstream spots (as Q2 was doing in Feb.), and lasting for a year or
two until they drift into the Red Spot Hollow. Meanwhile, as Damian Peach
pointed out, a new S.Trop.Band has started emerging from the p. end of the
GRS in late March.
S.Equatorial Disturbance: Hans-Joerg Mettig has shown that the track of
the old SED main complex has persisted on JUPOS charts for the last 5
years, and is presently around L1 ~ 100. Although it is not a conspicuous
feature, on April 4 a discontinuity in SEBn was visible here, and another
was visible just p. the GRS at L1 ~ 330; however, both then dissipated
again.
N.Tropical region: Since the classical NEB expansion event in 2004, the
NEB is very broad, and barges and portholes are appearing within it as
predicted. Most of them are very small, but 6 barges (cyclonic
reddish-brown spots) and 7 portholes (AWOs) can be tracked; all but one of
each are new this apparition. They are shown on the attached JUPOS chart,
with provisional numbers. The longest-lived AWO is our old friend, white
spot Z, still prograding more rapidly than any other of these spots: it is
presently at L2 ~ 45, DL2 ~ -9 deg/month.
N.N.Temp. region: The NTB is still absent, though a tenuous N.Tropical
Band is visible in enhanced images. The dark belt is NNTB; a long segment
was present in Dec. but has expanded since then, and in recent weeks has
also become strikingly reddish. This may be coupled to the vigorous
outbreak of NNTBs jetstream spots, which was active last apparition and
still persists. In the NNTZ latitude, there are two long-lived AWOs. One
of these, at L2 ~ 30, was methane-bright in 2003/04 and also on 2005
Feb.20 (Antonio Cidadao). So far this apparition there have been very few
good methane-band images; more would be useful.
John H. Rogers,
British Astronomical Association.
BAA Jupiter Section. Interim Bulletin. 2004 October 1st -
December 31st.
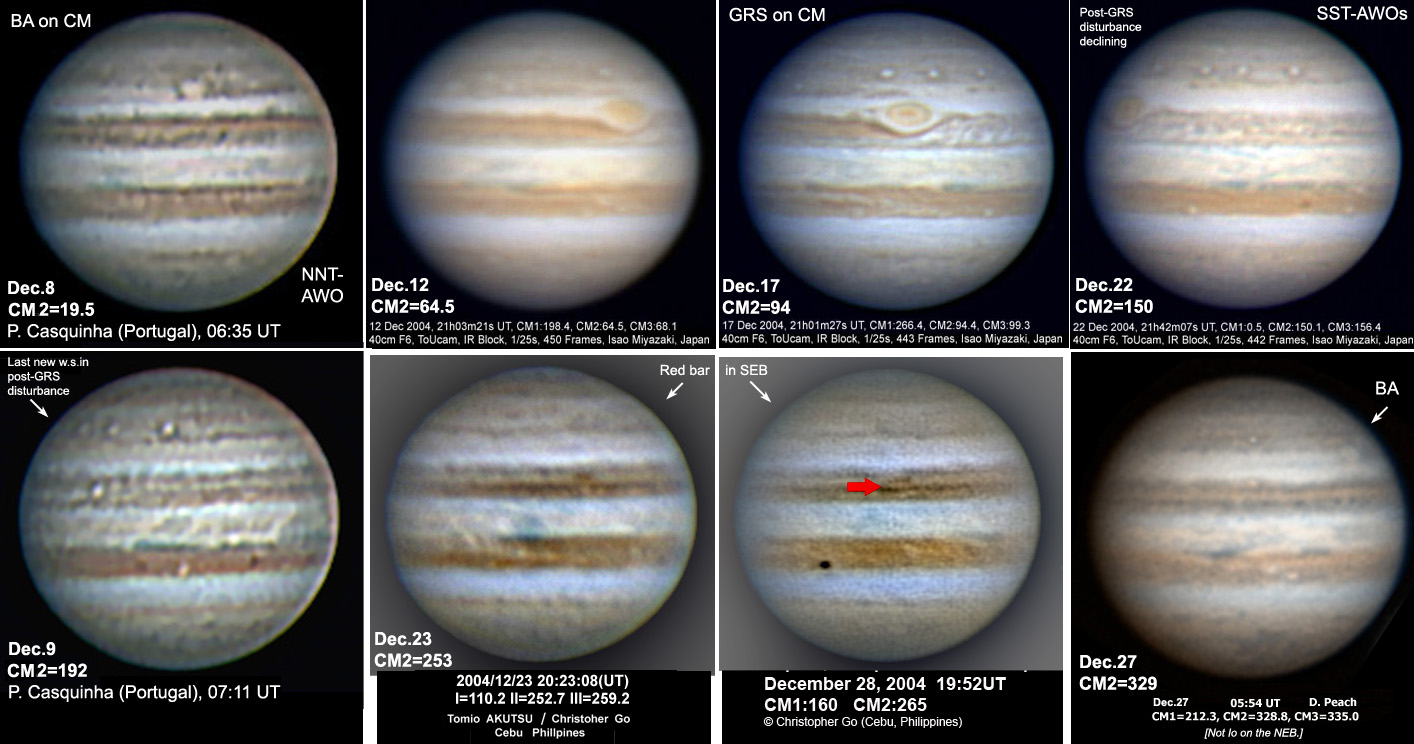
Jupiter emerged from Solar conjunction in September, and is now well placed for
observation in the morning sky. Despite this, image submissions have been rather
low. This brief report is based primarly on images by Isao Miyazaki (Japan) who
has provided a steady flow of images since the beginning of October. Toshihiko
Ikemura (Japan), Tomio Akutsu (Japan), Paolo Lazarrotti (Italy), Damian Peach
(UK), David Tyler (also UK), Chris Go (Phillipenes) and Paulo Casquinha
(Portugal) also sent images. Below follows a brief summary of notable features
seen on images of Jupiter so far this apparition:
North Equatorial Belt (NEB.): Has now reached the culmination of its current
expansion event. The belt now <<is now developing>> the classic
appearance of bright "portholes" and dark brown barges as is typical
of past such events; There are 4 portholes and 2 barges, but more may develop.
Observers should also look out for any colour change in the NEB. A long rift has
been present within the belt since at least early November, and stretches over
100 degs in length. Its f. end located at L2=80 can be seen on the attached
projection map, created by Peach from Miyazaki's images of Dec 17th.
The North Temperate Belt is still absent.
Equatorial Zone (EZ): Continues with a rather chaotic appearance. Several dark
NEBs projections are present, a particularly prominent one being located at
L1=355 (Dec 13th Miyazaki, Go/Akutsu) and another at L1=190
(Dec 27th, Peach.) A yellowish coloration also persists in the zone, well seen
in good quality colour images.
South Equatorial Belt (SEB): Continues as a broad dark belt with no notable
fading. The post-GRS turbulent area continues to erupt white spots. There had
evidently been an extension of this activity to L2 ~ 150 some time before
mid-October, and new white spots were appearing up to L2= 169 up to early
December, but in mid-December the activity was declining and prograding with
smaller-scale turbulence. The SEBs jetstream has shown increased activity, and
several spots have been seen in high quality images. One such spot was imaged by
Miyazaki on Dec17th near the edge of the RSH (see attached map), and later on
Dec
22nd, had entered the RSH.
GRS: Remains quite dark, with a greyish rim. Located at L2=99.5 (Dec 17th.)
Oval BA: Passed the GRS without incident during August 2004. It now appears
prominent, with a darkened rim. Currently located at L2=16.7 (Dec 27th.) Its
drift in L2 was -0.47 deg/day during November, and -0.54 deg/day during
December. The small white anticyclone following oval BA now appears more
prominent than last apparition, and the South Temperate Belt section f. oval BA
has also revived, and now comprises dark material f. the oval for about 60
degrees.
South South Temperate Belt (SSTB): Six small anticyclonic ovals followed
during the last apparition remain prominent. The main group of five is currently
passing the GRS as seen in the attached map.
- - - - - - - - - - - - - - - - - - - - - - - - -
Damian Peach & John Rogers
(British Astronomical Association)
2005 Jan.4
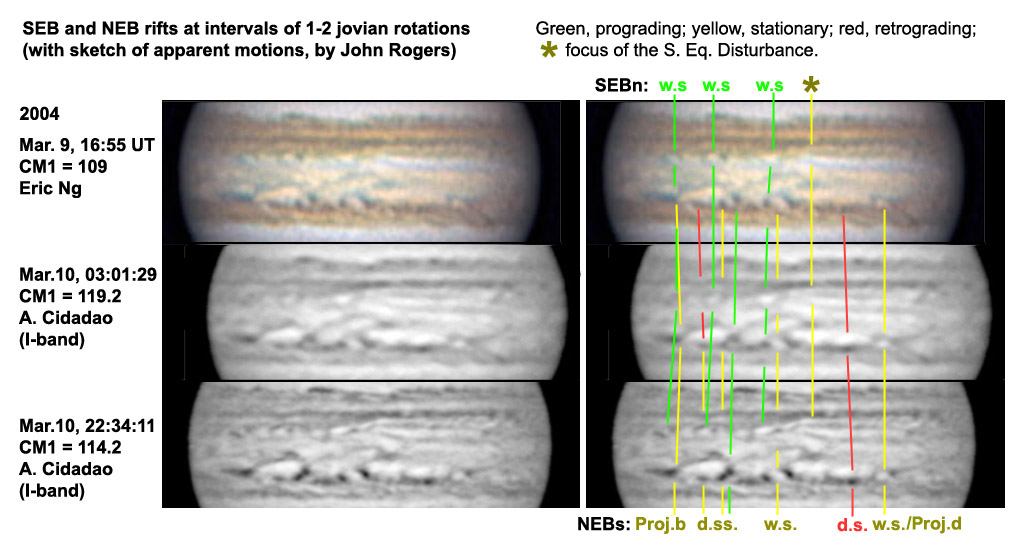
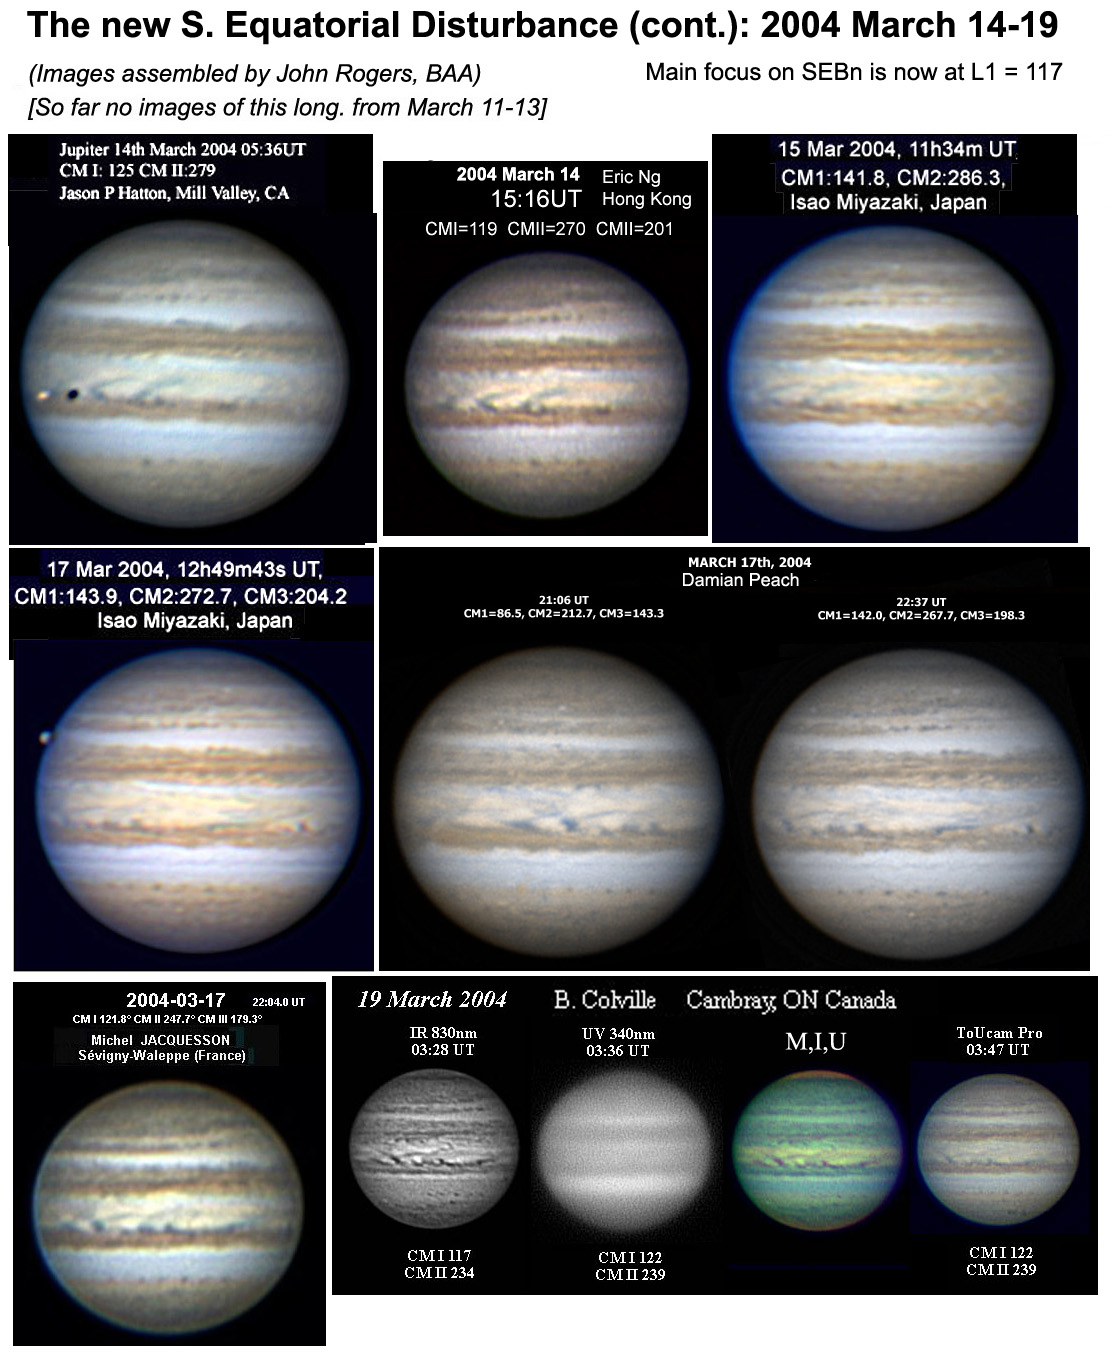
A NEW SOUTH EQUATORIAL DISTURBANCE,,
2004 FEB.-MARCH
In late February, 2004, just preceding the GRS, a new South Equatorial
Disturbance has appeared on SEBn at L1 ~ 100. As of mid-March, 2004, the
main focus has drifted up to L1 ~ 117 and there is increasing small-scale
disturbance p. it. It appears very similar to the SED of
1999-2002 (see the BAA reports), but whether it will persist remains to be seen.
The present appearance (March 17) is quite subdued but it may well
become more prominent when it next passes the GRS in early April. Some montages
of images showing it are here [LINKS].
Below is a bulletin from the first few days of its appearance.
- - - - - - - - - - - - - - - - - - - - - - - - - - - - -
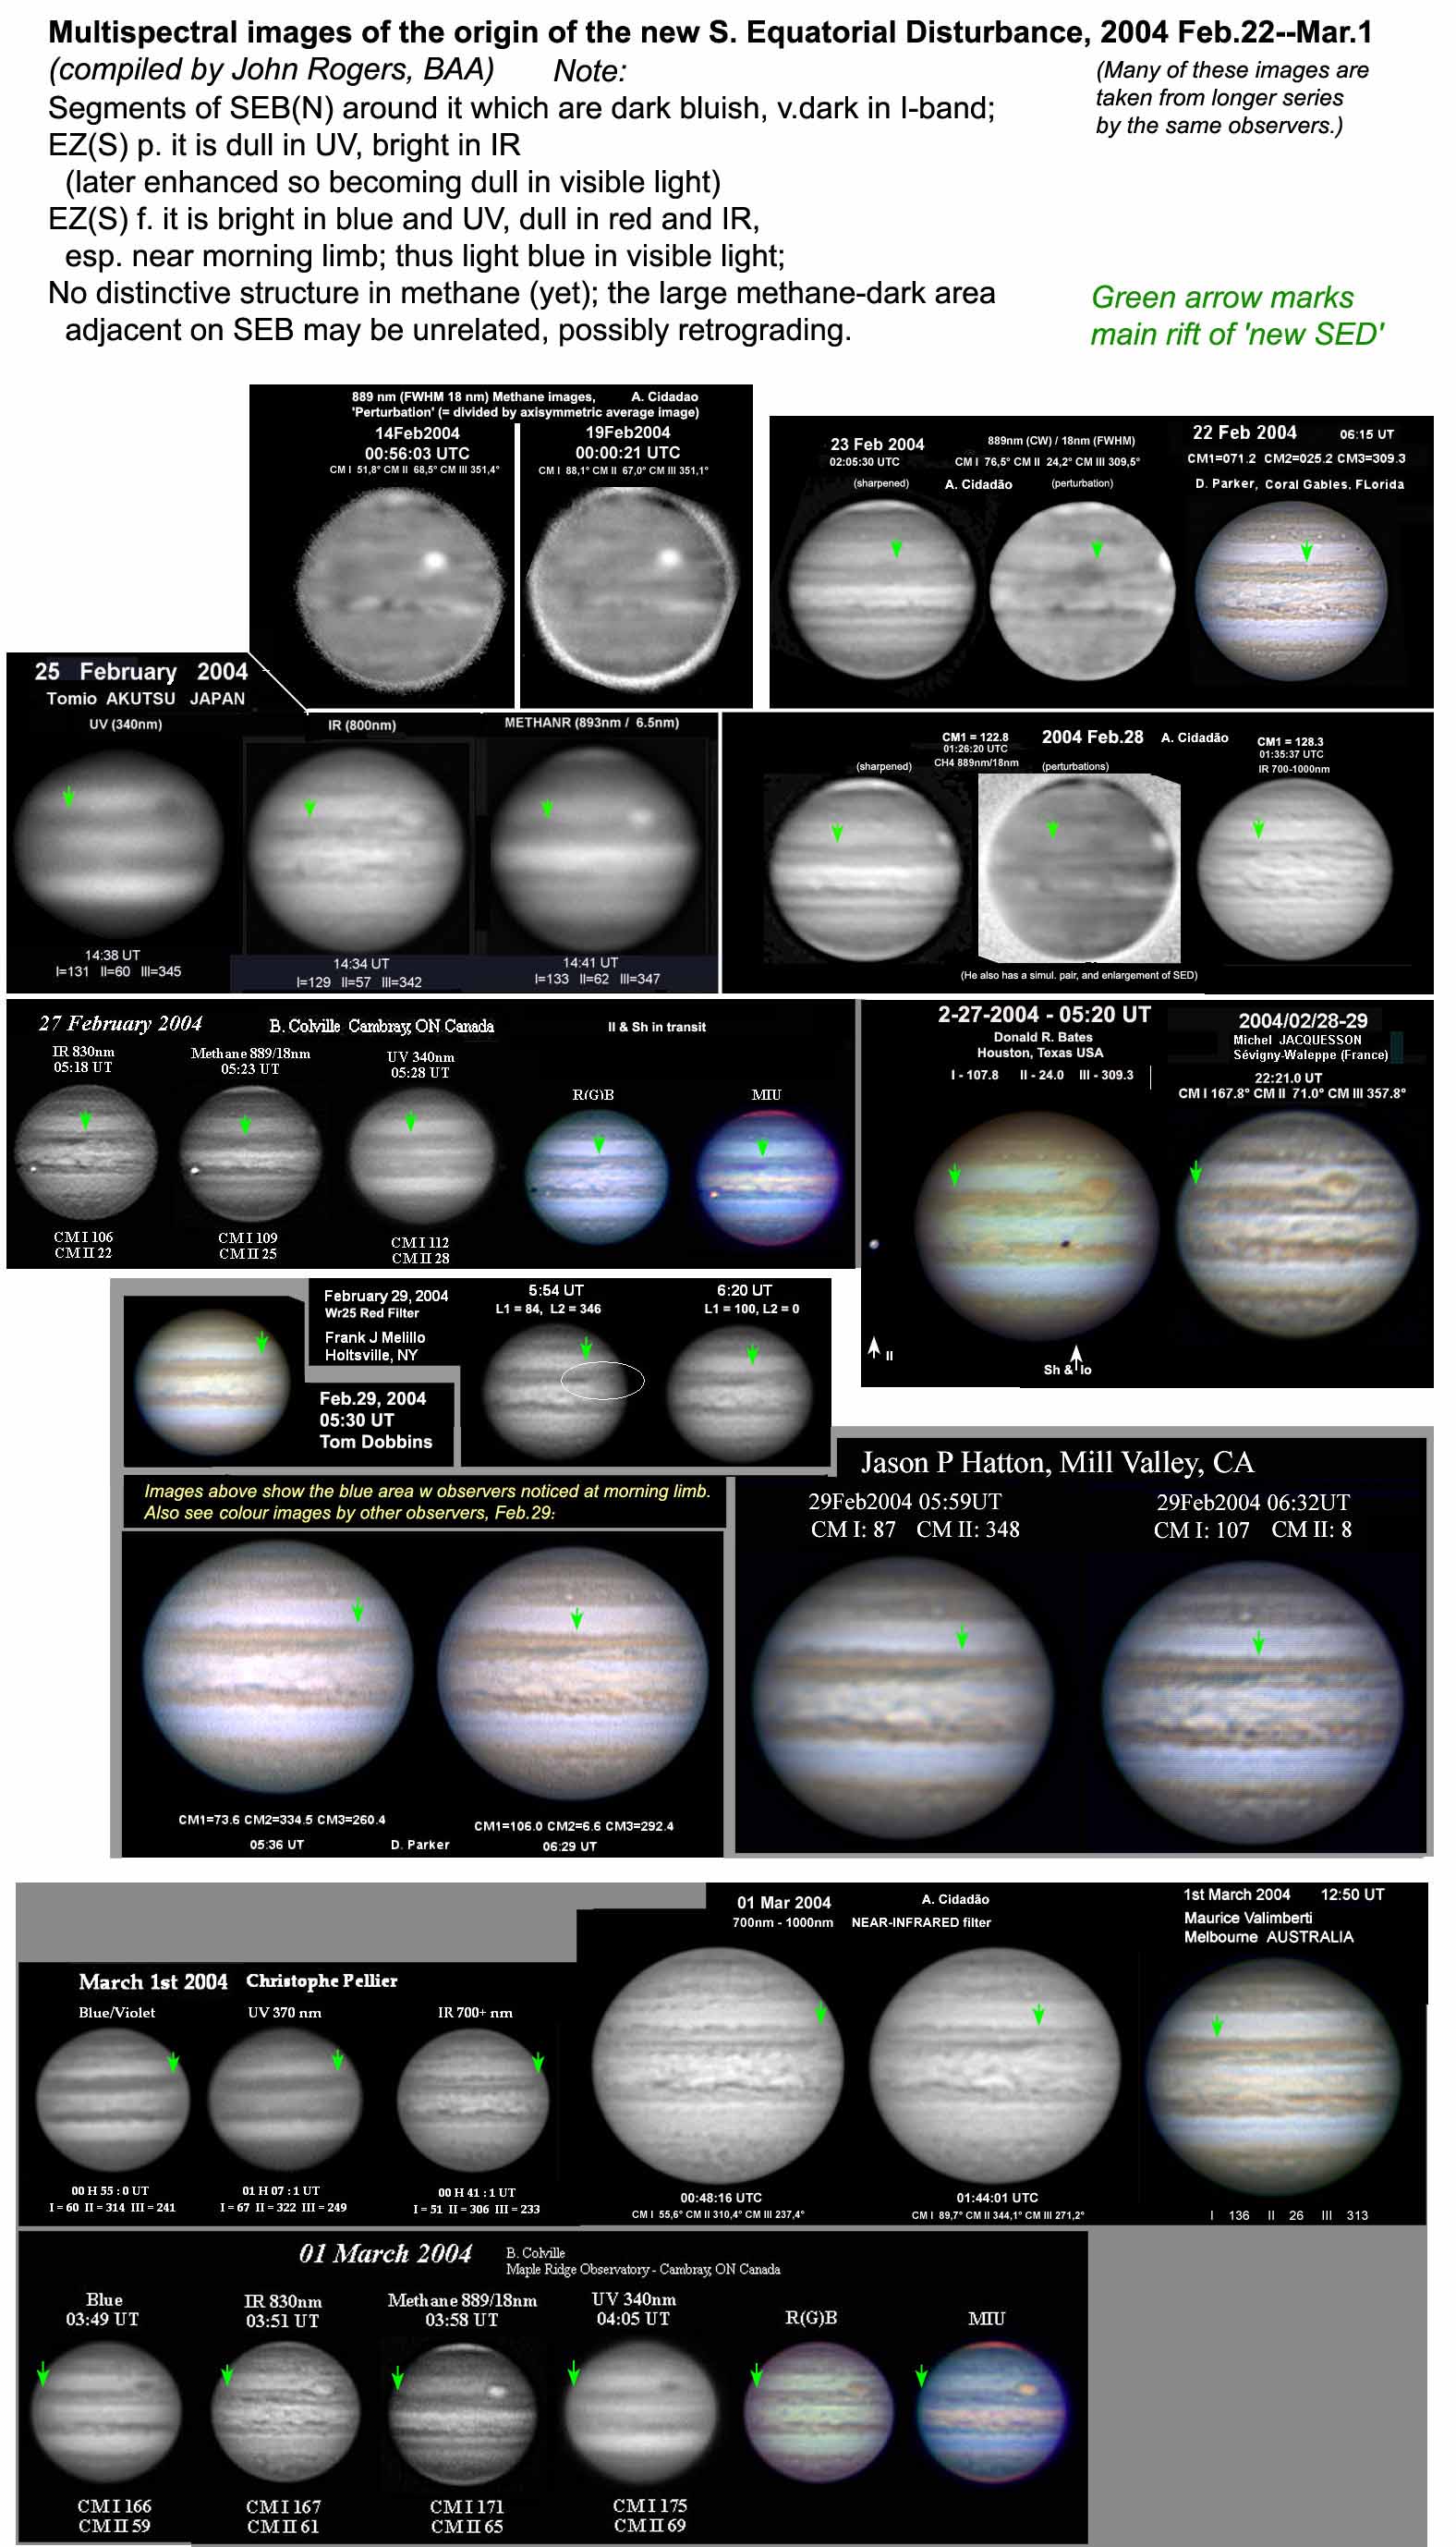
Bulletin sent 2003 March 3:
In late February a new disturbance on Jupiter's SEBn has attracted attention, as
it developed p. the GRS. Attached are two montages of hi-res colour images
showing the region p. GRS, where these interesting new features have appeared in
SEBn/EZ(S).
The first item, a little bi-coloured feature spotted by Jesus Sanchez on Feb.14,
was at L1 ~ 40. Then around Feb.22-25, disturbance developed
up to L1 ~100, in the same longitude range p. the GRS. I think it is too
early to be sure of the nature of this disturbance, or of the associated
methane features, that were shown in Antonio Cidadao's images on Feb.23 and 28.
At its start, the 1999 SED was not prominent in (lower-resolution) methane
images. The visible appearance is reminiscent of the 1999 SED, and Hans-Joerg
Mettig's analysis suggests it may be the same disturbance. On
the other hand, it could be a disturbance primarily of SEBZ, propagating p. past
the GRS (perhaps a late effect of the mid-SEB outbreak last
summer?), which secondarily disturbs the SEBn/EZ(S).
On Feb.29 and March 1, several observers have noticed it on their images, as it
has developed a prominent rift in SEB, and when it comes round the
morning limb there is a large diffuse light blue area in the EZ(S). This
was noticed by Tom Dobbins, Don Parker, Christophe Pellier, Antonio
Cidadao, Frank Melillo, and Brian Colville. As Tom Dobbins says:
"I am struck by the fact that the SEBn/EZs Disturbance appears very blue
when near the limb, but this hue becomes quite subdued when near the CM. This
property strikes me as rather peculiar, as the festoons emanating
from the NEBs don't behave like this to my knowledge. It must be a function of
optical path length and scattering...."
As several observers have sent UV, IR, and methane images of the region, it may
be possible to say more on this shortly.
John Rogers, 2004 March 3
&&&
PS, March 20:
Multispectral images so far show:
Methane: Nothing distinctive. (This was also true of the 1999 SED for its first
6 months; then it became very impressive in methane wavebands.)
I-band (near-IR continuum): It has most contrast in this waveband. UV:
EZ(S) is UV-dull p.the SED, and UV-bright f. it.
Image montage #1 of the new South Equatorial Disturbance.
Image montage #2 of the new South Equatorial Disturbance.
Image
montage #3 of the new South Equatorial Disturbance.
Jupiter in 2003/04:
INTERIM REPORT ON NORTHERN EQUATORIAL REGION
John Rogers (British Astronomical Association), 2004
March 8
Summary
The
northern equatorial region [EZ(N) and NEBs] is particularly active and
interesting this apparition, and is in a similar state to that during the
Voyager encounters in 1979. Common
features are:
1)
Weak yellowish shading in EZ(N)
2)
Prominent NEBs dark projections and bright plumes
3)
A long-lived rifted region in NEB.
Moreover,
two phenomena are being observed in 2004 which confirm discoveries made in the
1979 data:
4)
NEBs dark projections are enhanced when passing the NEB rifted region;
5)
In EZ(N), UV-bright areas are displaced from the corresponding visibly-bright
areas.
Introduction
The
features of the northern equatorial region are some of the most conspicuous on
Jupiter, but they are still not fully explicable nor predictable.
They include the great dark patches ('NEBs projections' or 'infrared
hot-spots'), and bright areas that separate them, sometimes developing into
white plumes. The dark patches are
now known (since the Galileo Probe descended into one of them) to be deep clear
cloud-free weather systems [see Minireview 2001], and the plumes are
billowing white clouds. The region is overlaid by high-altitude haze which
appears bright in methane wavebands but variably dark in ultraviolet.
The region is also subject to episodes of obvious yellow or ochre colour,
most recently in 1990-92; this colour is generally thought to be an
intensification of the blue and UV absorption in the high-altitude haze.
This
report analyses amateur imaging data from 2003/04 in the following wavebands:
Visible (colour images); UV (centred at 340 or 360 nm, sensing mainly the
high-altitude haze, which may be dark in this waveband); Methane (890 nm, also
sensing the high-altitude haze, which reflects brightly in this waveband); and
I-band (near-infrared, probing deeper into the main clouds, and revealing the
dark NEBs projections with very high contrast).
I
compare these data with Voyager images from 1979, which were taken in visible
and UV (345 nm) wavebands, but not in the infrared.
Credit
is due especially to Tomio Akutsu, Antonio Cidadao, and Christophe Pellier, for
their multispectral images in 2003/04 and for discussions about them; to all
other observers whose hi-res images are included; and to Hans-Joerg Mettig,
Gianluigi Adamoli and
Michel Jacquesson. for performing the JUPOS measurements and analysis. For Voyager images, credit is due to NASA and the Voyager
Imaging Team (leader Bradford A. Smith). The original images are obtained from
the NASA website at:
http://ringmaster.arc.nasa.gov/catalog/vgriss.html.
Analysis
1)
Weak yellowish shading in EZ(N)
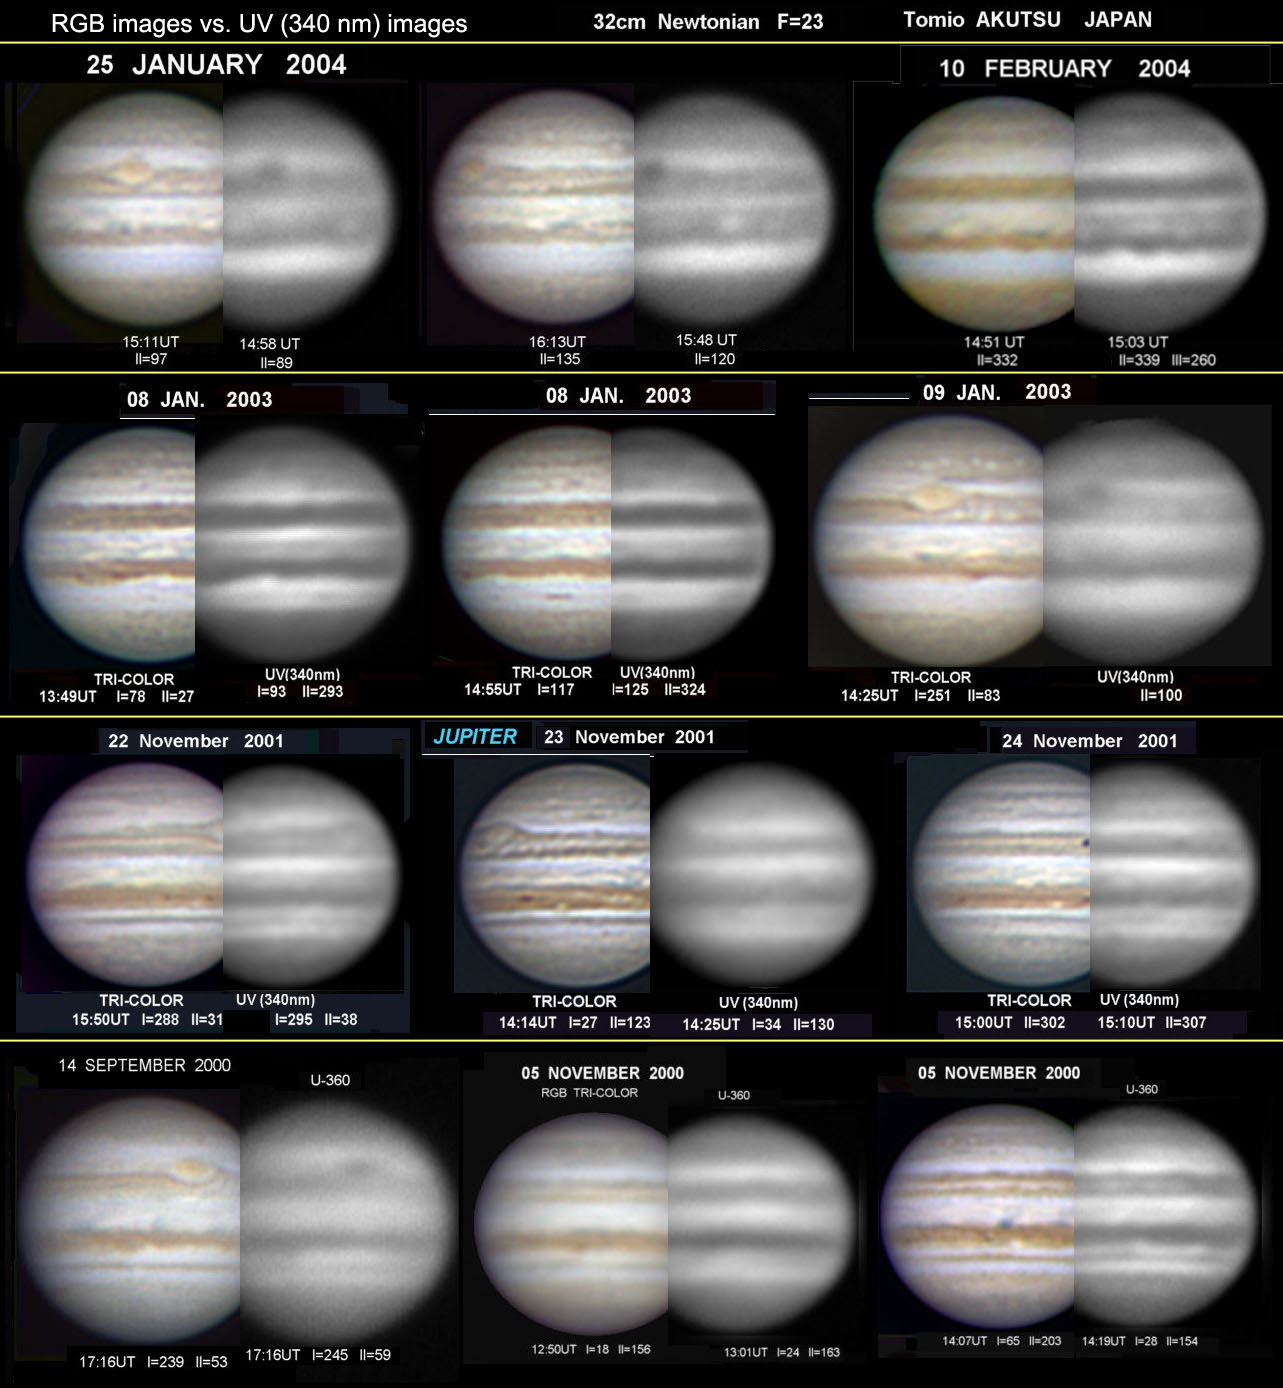
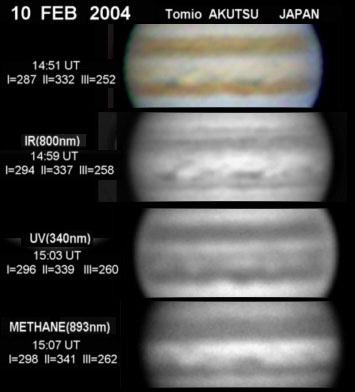
For
most of the last 10 years, this pale yellowish shading has been evident in
visible-colour images, and confirmed by the comparative darkness of EZ(N) in
violet and (esp.) UV images. (Fig.1)
It was absent in 2000/2001, when the whole EZ became bright white, but it
became quite strong in 2001/02, and seems to be quite strong again in 2003/04.
This
coloration is not strong enough to be seen by visual observers, so it does not
qualify as a distinct coloration event. Thus the situation is at first glance
very different from that in 1979, when there was strong yellow-orange colour
over much of the EZ. However the difference is mainly in the EZ(S); the
coloration in EZ(N) is actually quite similar in 1979 and 2004.
(Recall that Voyager pictures are usually shown with exaggerated
redness.) In both apparitions, the
mixture of background colour, intricate festoons, and active plumes, produces a
beautiful network of blue-grey, white, and yellow streaks in EZ(N).
Discussion: Although yellow coloration is generally thought to be in the high-altitude haze layer, there is no evidence that this layer is thicker than usual in 2004. Visible colour images do not suggest that the colour obscures other features, and methane images do not show any new reflective layer – in fact many of the dark NEBs projections are unusually prominent in methane images this apparition. This suggests that we are seeing a change in colour (increased blue and UV absorption) but not an increase in thickness of the high-altitude haze layer.
The
array of dark bluish plateaux and projections and festoons on NEBs in 2004 is
fairly typical, but perhaps more prominent than for several years. This is
partly because the yellowish shading highlights the bright whitish areas between
the projections, and some of these are active plumes (i.e. with a small bright
core). The situation was the same in 1979, and in both years there are about 11
of the dark projections spaced around the NEBs.
(See Fig.2: JUPOS chart, 2003/04, with the main persistent features
marked and given provisional letters [a-h, k,l,m].)
Fig.2
shows that these features all have an exceptionally slow drift this year:
they are retrograding at DL1 ~ +7 to +14 deg/month relative to System I. (This
was not the case in 1979.)
Fig.2:
Superimposed JUPOS charts for lats.+4/+7/+10 deg.N, 2003/04, with
provisional nomenclature for the major NEBs projections.
3)
A long-lived rifted region in NEB.
This
was first identified by Mettig from his JUPOS charts of white spots in the NEB.
Fig.3
includes the chart from 2003 Nov. to 2004 Jan., and identifies a 'source'
white spot(s) (or rift) with DL2 = -3.6 deg/day, which has produced at least 4
spots (or spot-groups or rifts) with DL2 ~ -5.7 deg/day.
The source was at L2 ~ 0 around Dec.3, when it seemed to become more
active; and at L2 ~180 around 2004 Jan.18. Moreover the 'source' spot(s) are all
between +11/+13 deg.N, whereas the more-prograding spots are distributed between
+9/+12 deg.N.
Compilations
of images were made to examine the structure of the source region.
The first set, comprising the few suitable images from 2003 Dec., each
showed a bright spot in the *southern* half of NEB near the proposed source.
Although these spots may have been temporary clouds billowing from the source
(as their positions are quite scattered), their latitude (11 to 13 deg.N) agrees
with the drift rate for the source. There
was also a subtle rift extending Nf. from the arrowed spot in each case,
probably representing minor disturbance spreading Nf. from the source.
From mid-Dec. the rift became more conspicuous (Fig.4:
green zigzag underlining), but its drift implies that the focus of the
disturbance was still at the same latitude.
The rift developed rapidly: by mid/late Jan., 2004, there was a long
white rift spanning and preceding the source region (Fig.5).
This was passing the GRS (L2 ~ 90) in mid-Feb., and is still prominent in
March.
The
charts for 2002/03 (also in Fig.3)
also showed many rapidly-moving white spots or rifts, between +9/+12 deg.N. It
is possible that these were arising from the same source region, but it was not
clearly defined. In contrast the
chart for 2001/02 (not shown) showed most spots moving more slowly, from a
persistent rifted region with DL2 ~-0.9 deg/day at +12/+13 deg.N, but more rapid
and southerly rifts arising from it. Overall, the JUPOS analysis over
the past few years provides a hi-res database of
such spots which clearly shows the gradient of speed with latitude across
the NEB.
In
1979, there was also a persistent rifted region, but it was centred slightly
further north and moved more slowly, DL2 = -0.9 deg/day. Then as now, individual
white spots were observed arising within it and accelerating to faster speeds,
as dramatically shown in the Voyager movies [Smith et al., 1979; Book
p.124]. This rifted region had
arisen in 1977; it gradually expanded until it was ~120 deg. long in 1981, and
by 1982, rifts could be seen at any longitude.
Discussion:
Rifts in the NEB are turbulent cyclonic disturbances; the white spots are
erupting white clouds which include thunderstorms.
The nature of these persistent active regions, which generate transient
rifts propagating p. (to S) and probably f. (to N), is mysterious and could be
illuminated by further observations of the present one.
Fig.3:
JUPOS chart of NEB rifts, 2002-2004 (by Hans-Joerg Mettig).
This shows longitudes of all white spots in the NEB, colour-coded for
each one-degree band of latitude, in a longitude system moving at DL2 = -5.0
deg/day.
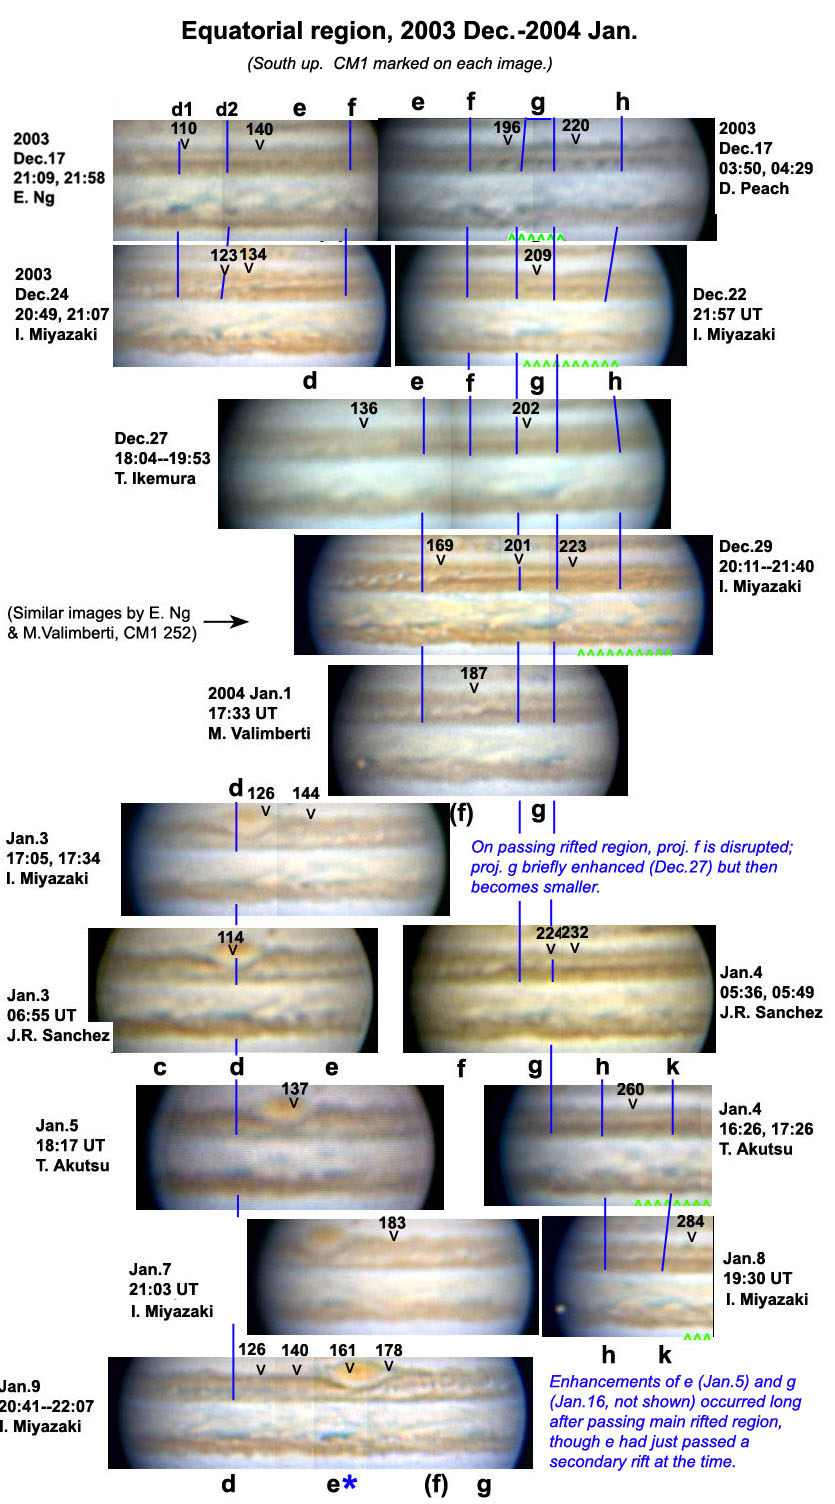
Fig.4:
Alignment of images in 2003 Dec.-2004 Jan. Dark NEBs projections are
lettered as in Fig.2, and the NEB rifted region is underlined with green zigzag.
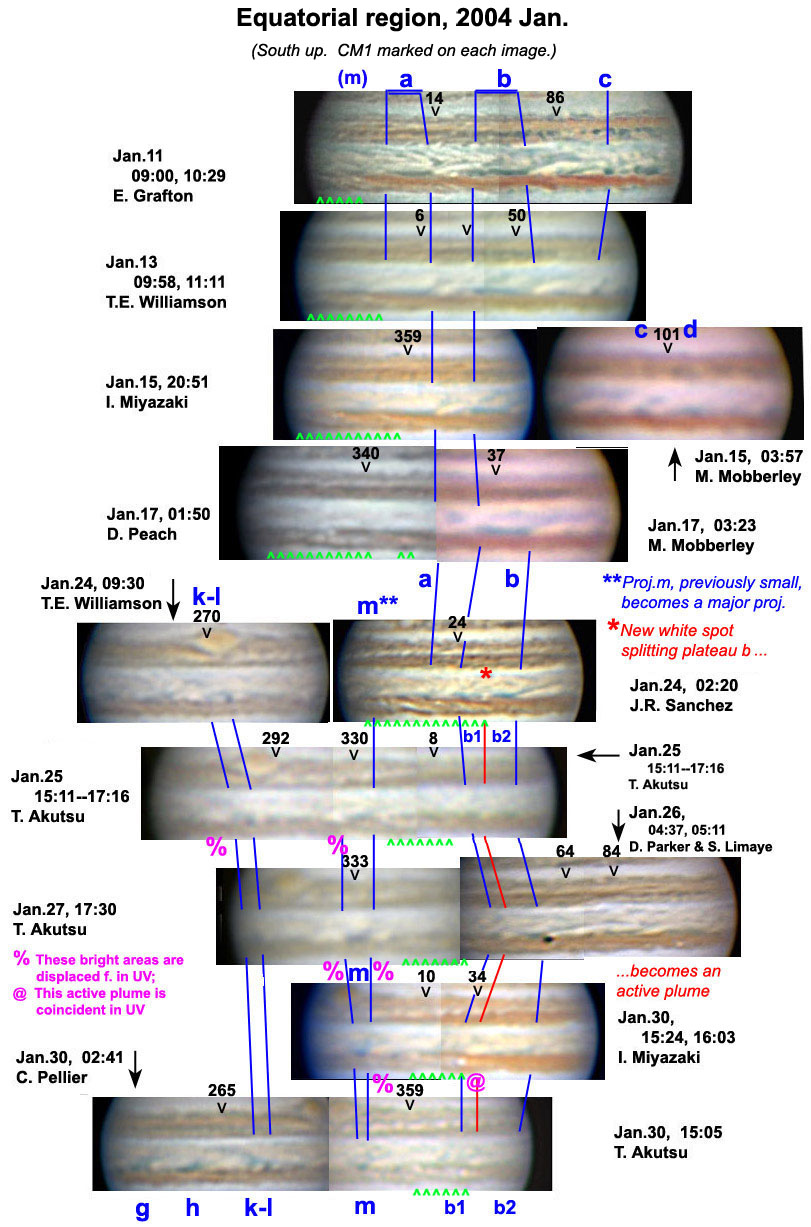
Fig.5:
Alignment of images in 2004 Jan.
4)
NEBs dark projections are enhanced when passing the NEB rifted region.
I
had previously reported that the dark patches/projections on NEBs are often
intensified or enlarged or disrupted as they pass NEB rifts, as observed both
visually and in Voyager images [JBAA, 1988; book p.139-141].
Few such interactions have been observed in recent years because the NEBs
projections and/or the NEB rifts have not been sufficiently regular and
persistent. The prominence of both in the present apparition affords an
opportunity to look for these interactions again.
Indeed,
compilations of images from 2003 Dec. and 2004 Jan. show several such
interactions. (See Fig.2 for
tracking of NEBs projections, and Fig.4 to Fig.7 for alignments of
the Eq.R. in images.) The first
enhancement noted was of proj. e (Jan.5), when passing a secondary rift some way
p. the persistent one. Proj. g was
also enhanced, very briefly when passing the main rifted region (Dec.27), then
again much later (Jan.16). A
classic example of enhancement of a projection as it passed the rifted region
was proj. m (Jan.25); having become large and dark, it acquired a white core to
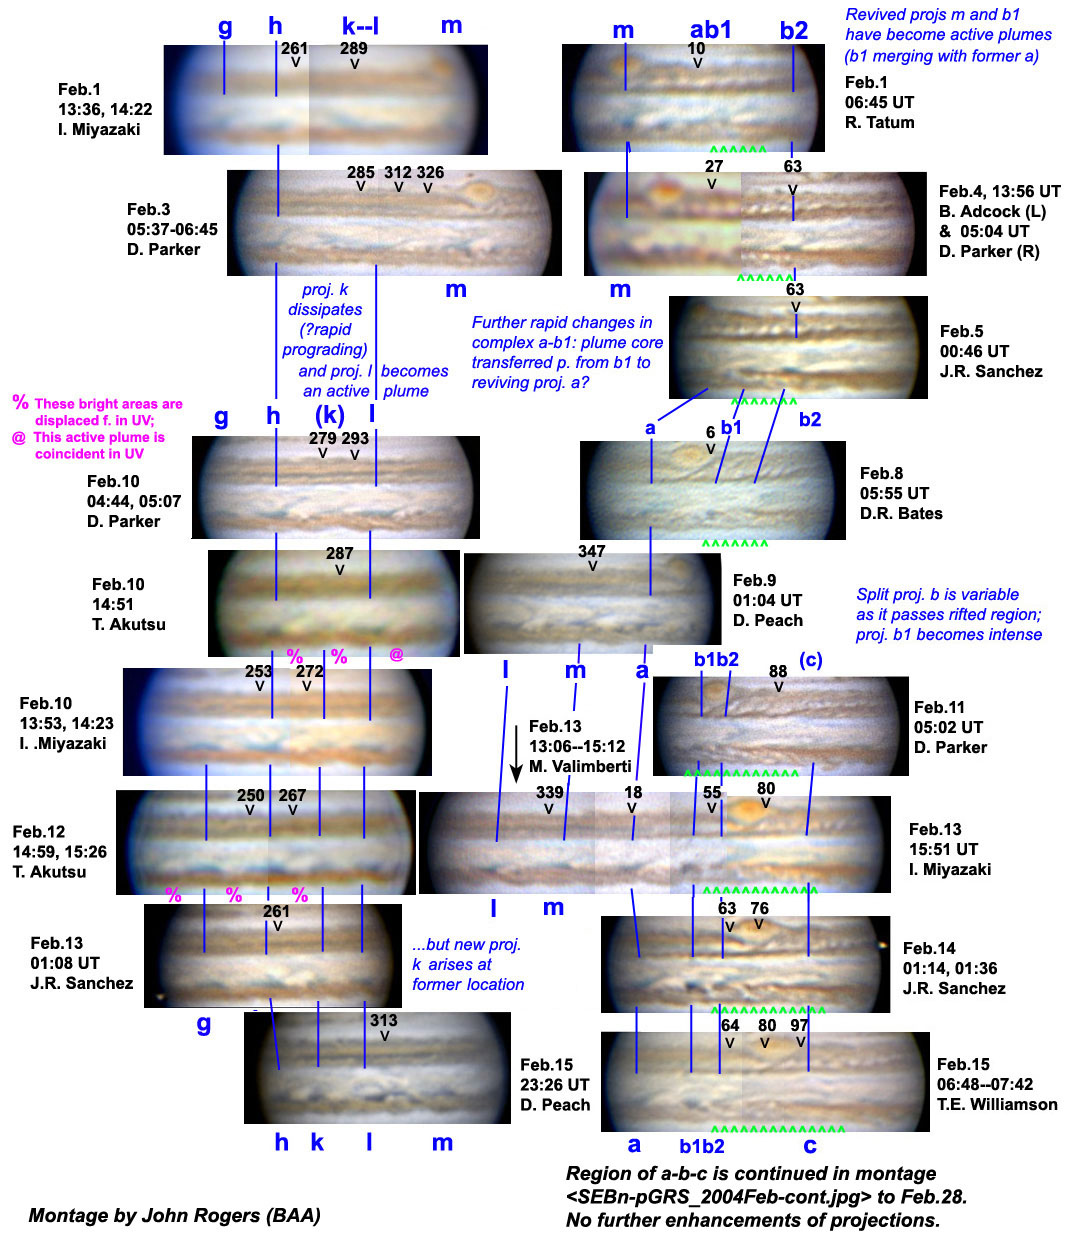
become an active plume (Feb.1). Meanwhile proj. b, a long low plateau starting
to pass the rifted region, was split by a new white spot (Jan.24) converting the
p. half (proj.b1) into a bright-cored plume; this also merged with disrupted
proj.a, p. it, so the whole sector was very disturbed as it continued to pass
the rifted region, including intensification of dark proj. b1 (Feb.13).
There were also continuing changes in projections which had already
passed the rifted sector, i.e.lying p. it: thus proj. k dissipated (Feb.10) but
revived (Feb.12). Fig.7 shows the
rifted region in late February but there were no further enhancements of
projections there at that time. (However a notable colour difference is
appearing in the NEB, which is greyish p.the rifted region but quite
reddish-brown f. it.)
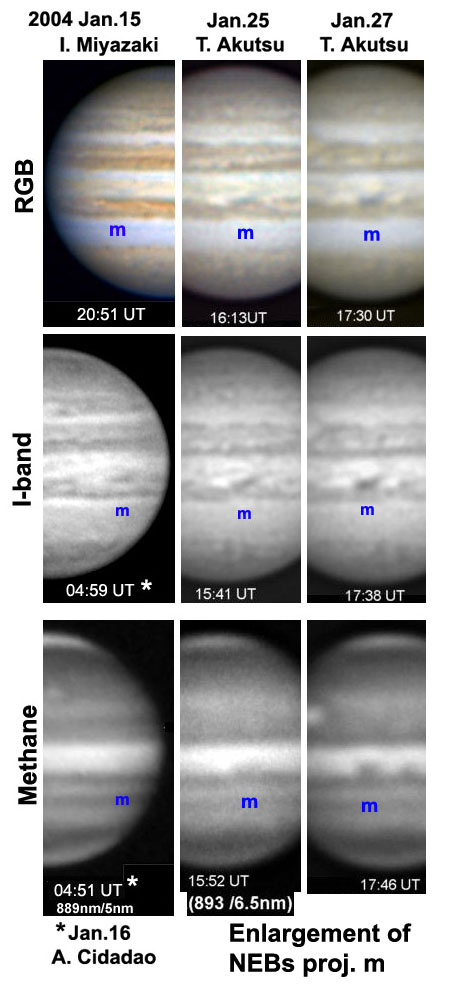
The
enhancement of proj. m is shown in detail in Fig.8, in I-band and methane
wavebands as well as visible colour. In
visible and I-band, the apparent enhancement is mainly due to new white spots
which appeared p.and f. the dark projection, enhancing it by contrast, and
extension of the dark projection into the belt, but no extension southwards.
However both the dark projection and its festoon to Sf. also became
darker in I-band, and apparently in visible colour (though these impressions
could be susceptible to the image-processing).
In methane, on the other hand, the formerly invisible projection appeared
as a very dark feature extending even further south than the visible
counterpart. This suggests that
disruption of the overlying haze layer was a major part of the intensification
in all three wavebands.
This
can be compared with the account of another such enhancement given from Voyager
images in 1979 [JBAA, 1988; book p.139-141].
The changes in visible shape were not the same, and this testifies to the
very dynamic effects that these rifted regions have on the NEBs projections.
Fig.6:
Alignment of images in 2004 Feb. [2004Feb_EqRset]
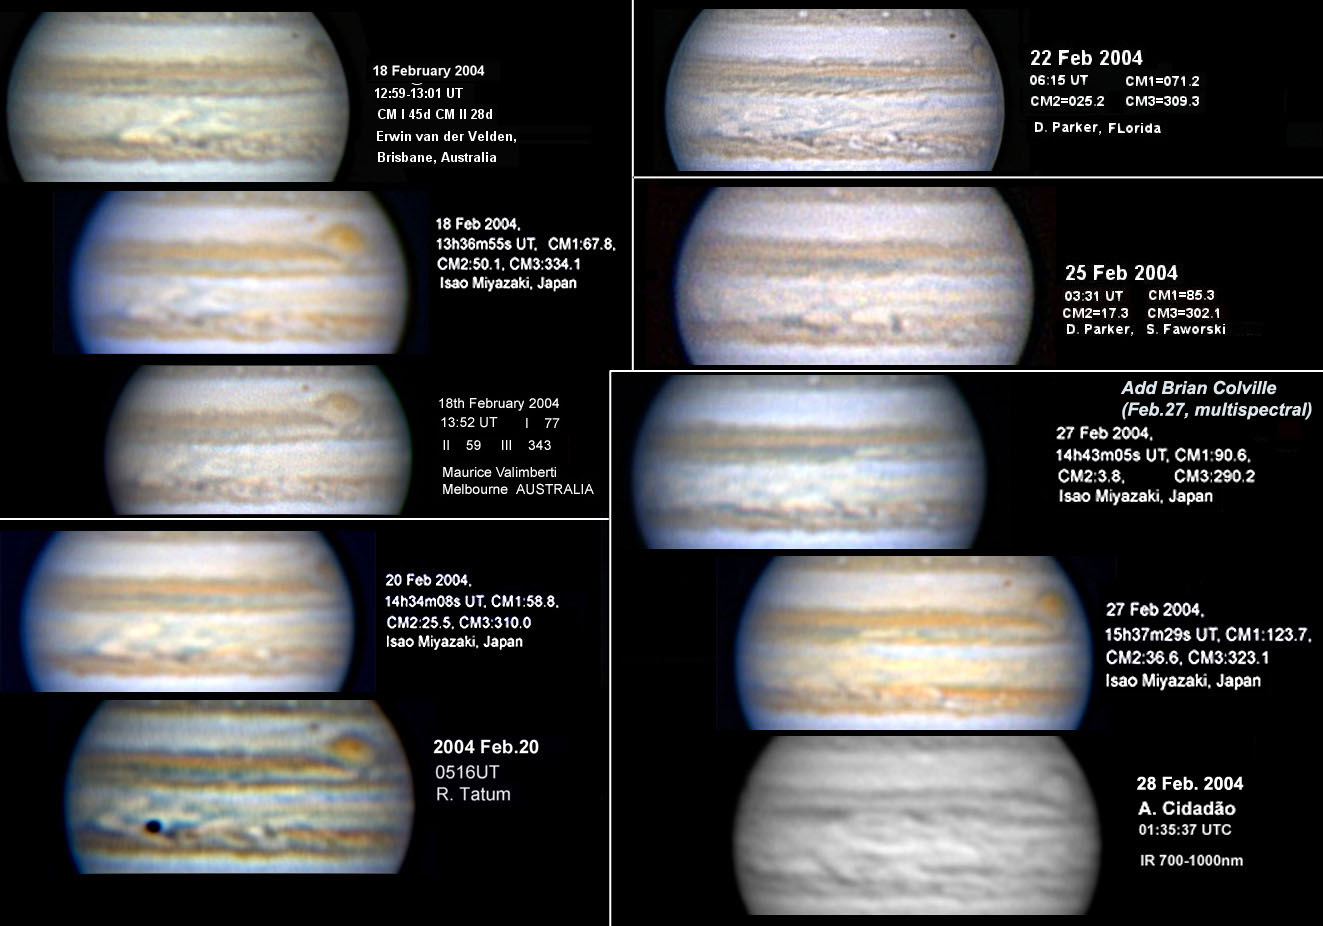
Fig.7:
Alignment
of images in 2004 Feb., continued, p.the GRS.
This also shows the origin of the new South Equatorial Disturbance.
[2004Feb_EqRset-cont-pGRS]
Fig.8:
Detail of the enlargement of projection m, at different wavelengths,
aligned in latitude. [NEBs_m_enlarge].
I-band shows detail within the main cloud layer; the methane waveband
shows hazes above the main cloud layer.
5)
In EZ(N), UV-bright areas are displaced from the corresponding visibly-bright
areas.
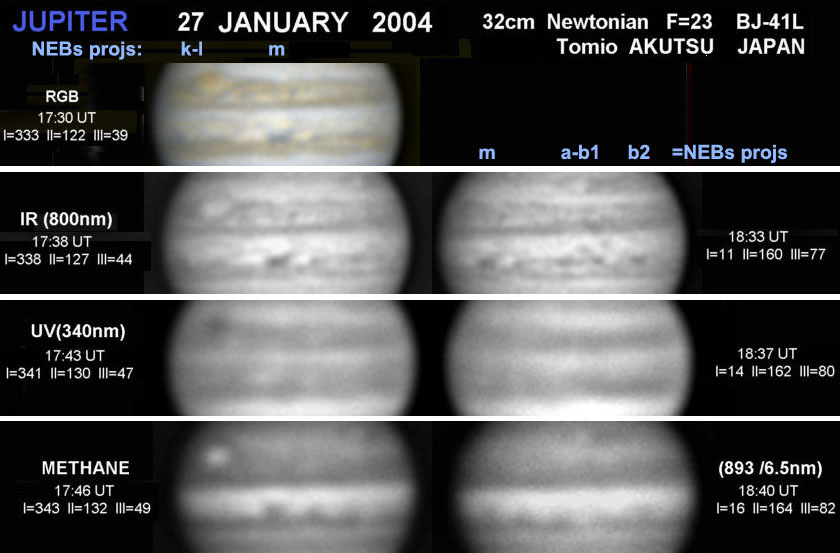
In
2004, this phenomenon was discovered by T. Akutsu in his UV (340 nm) images,
which mainly view the haze layer above the main clouds.
Whereas white bays are seen at matching locations in visible, I-band, and
methane images, in UV they are displaced f., sometimes even overlying the next
visibly dark projection. This is
especially evident in Akutsu's images on Jan.25, 27 (Fig.9), Feb.10 (Fig.10),
and Feb.12.
That
these UV-bright areas have not been remarked on before may be largely because
the quality of the images has been improving, but also perhaps because these
features are particularly conspicuous this apparition. These bright areas are
all among the projections which are passing, or have recently passed, the rifted
region (Fig.5, Fig.6).
These bright bays are particularly prominent in visible light but are
mostly not active plumes. In fact,
active plumes L and b1 are bright in UV at the same location as in visible
light. Other good images (including
some by C. Pellier and D. Peach), in regions with 'normal' dark projections but
no bright white bays, do not show prominent UV-bright areas.
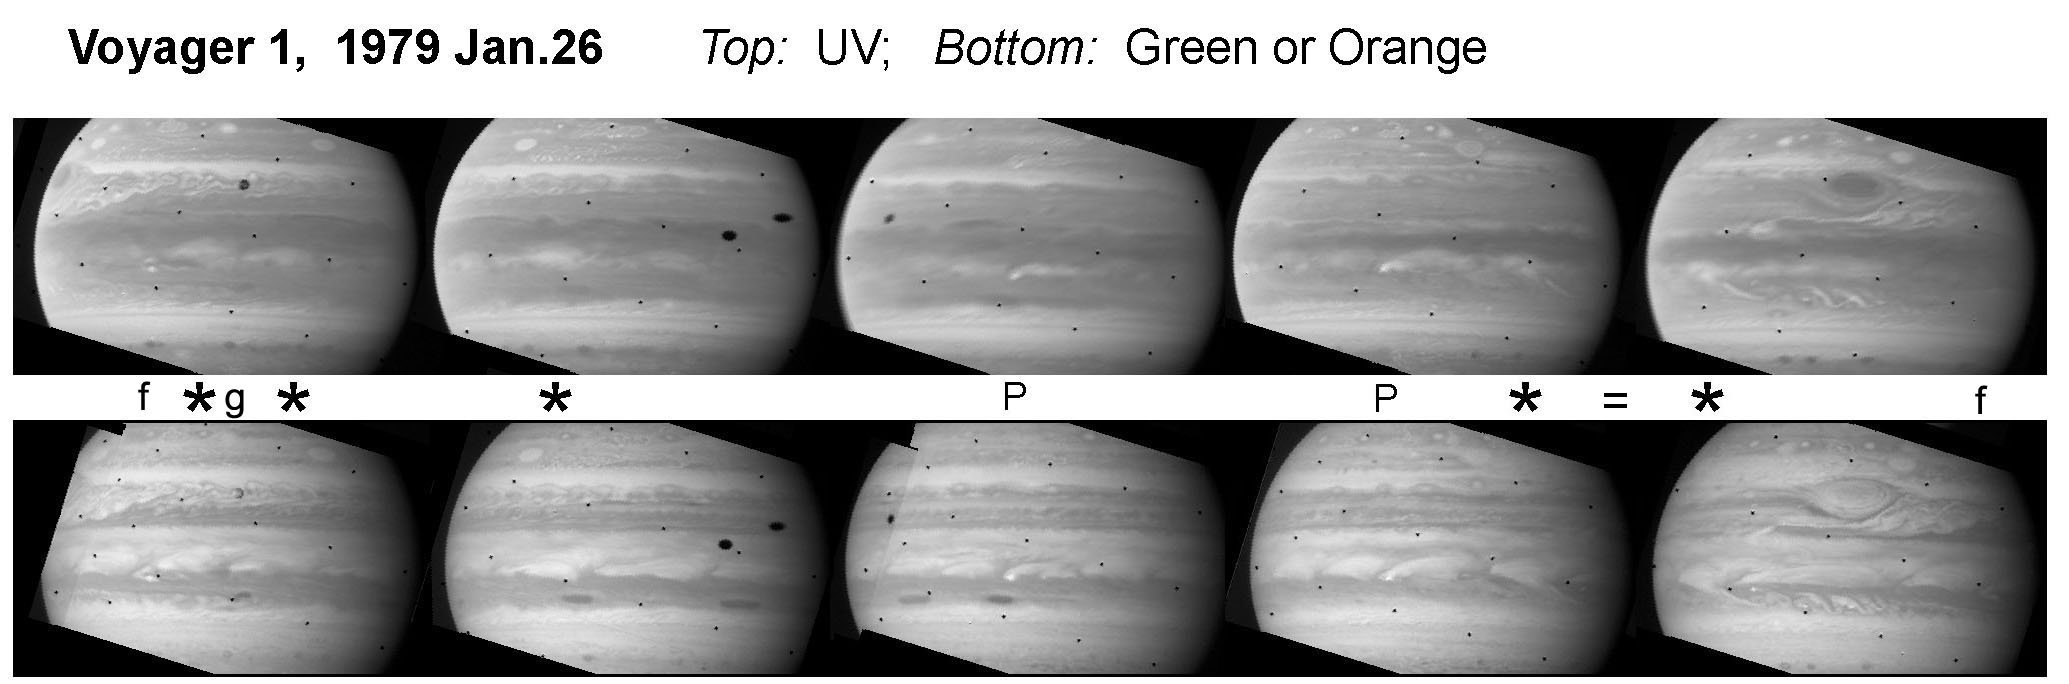
In
1979, exactly 25 years earlier, the same mismatch can be seen in Voyager images. Fig.11 shows one rotation of the planet on 1979
Jan.26, during Voyager 1's approach. Of
the 11 spaces between the 11 projections, 4 show distinct misalignment in UV
(marked *). If reduced to the same
resolution as ground-based images, the misalignment would be very similar to
that observed in 2004. It occurs
because the p. part is darker in UV than visible, whereas the f. edge is further
f. in UV, sometimes overlying the next visibly-dark projection. Some of the UV borders are ragged with streaks, presumably in
the high-altitude haze. The 4 bright bays in question appear prominent but
largely undisturbed. One lies just p. the rifted region (which is alongside the
GRS), which may well have enhanced the dark projections flanking it; the other
three are elsewhere. In contrast,
two active plumes (marked P) coincide in UV and visible, also as in 2004, and
are very bright in UV.
Discussion
on displacement of UV-bright areas: The
UV-visible misalignment is not entirely surprising as the dark projections,
being bluish, are known to be virtually invisible in blue and UV light, and the
UV images view the haze layer overlying them. However one might have expected
that the bright areas would correspond to the circulations between them and
would therefore coincide in all wavelengths.
It is generally thought that the visibly bright patches are circulation
cells that lie between the dark NEBs projections [see Minireview, 2001,
and Fig.12].
To
investigate whether the UV pattern was due to any detectable flow or circulation
in these cells, I assembled movies of the 3 consecutive mismatched bright areas
on 6 consecutive rotations, 1979 Jan.26-28, in UV and green images (data not
shown). Although there are some
changes in UV appearances (in the streaks around the UV-bright areas), which are
not correlated with visible changes, there is no sign of systematic motion. This
is consistent with previous studies of the Voyager visible-light images; even
Galileo, with targeted imaging on shorter timescales, found only incomplete
evidence of the inferred motions, though consistent with UV and visible streak
patterns (Fig.12). The inferred motions may well be present but not
revealed by resolvable features.
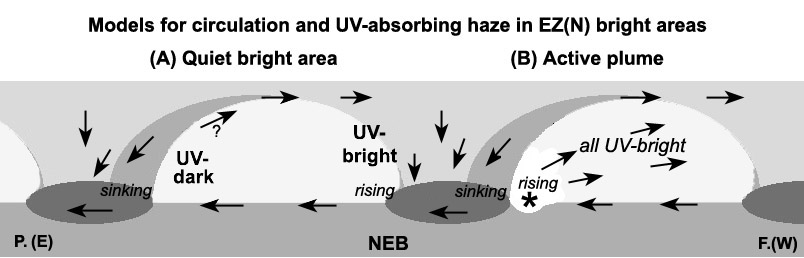
So
I suggest that the UV-visible misalignment is due to UV albedo of the haze layer
(Fig.12,A): UV-dark
('yellowish') in the p. parts of the circulation cells, but UV-bright ('white')
in the f. parts, which may overlie the adjacent blue-grey festoons. (Perhaps the
haze particles reside at high altitude for different times in the p. and f.
parts.) The methane images look different because the haze layer is
always bright in methane bands, but it is partly transparent in the near-IR, at
least at some times and places (esp. 2004), so the cloud-free dark projections
can be seen through it. It is
possible that major misalignments only appear when there is yellowish colour,
i.e. enhanced UV absorption, as in 1979 and in 2004.
The
situation with an active plume is different (Fig.12,B): the whole white
plume is UV-bright. This may be due to white particles wafted up in the plume.
The visual impression that white cloud could be expanding up and away in
the f. direction has been confirmed from Voyager images [Hunt et al., 1981;
JBAA, 1988; book pp.141-143]. One
plume front was tracked [JBAA, 1988] as it happened to coincide with the
dark patch expansion described above. In
fact this was projection f shown in Fig.11, a few days later: it
developed an active plume core, from which white cloud spread very rapidly f. in
the EZ(N), forming a front between the white plume material and the orange EZ
material, moving at DL1 = +3.5 deg/day, and actually crossing proj. g (the
projection which was then expanding) without interacting with it. This was an
alternative,, transient way in which a UV-bright area extended further f. than
the visibly bright area.
Fig.9:
2004 Jan.27:
the equatorial region imaged by T. Akutsu strips in visible colour,
I-band, UV, and methane.
Fig.10:
2004 Feb.10: the equatorial region imaged by T. Akutsu strips in visible colour,
I-band, UV, and methane.
Fig.11:
Voyager images on 1979 Jan.26, UV and green filters, taken at 2-hour
intervals to cover a whole rotation of the planet.
Projections f and g are labelled as in my earlier reports; bright areas
centred at different longitudes in UV are marked *; active plumes are marked P. (Amended from an earlier version that was distributed.)
Fig.12:
Model for the bright and dark areas of EZ(N), showing the circulation
patterns inferred from Galileo and Cassini imaging, and their relationship to
visibly bright areas (indicated by the background shading) and UV-bright areas (labelled).
It was Cassini's I-band movie, penetrating deeper, which clearly showed
the faster NEBs jet in the main clouds. [For more on circulations of these EZ(N)
cells, see Minireview, 2001.]
____________________________________
References:
Book:
Rogers JH, The Giant Planet Jupiter (Cambridge University Press,
1995).
Hunt et al., 1981:
Hunt GE, Conrath BJ & Pirraglia JA,
J. Geophys. Res. 86 (A10), 8777-8791 (1981).
JBAA,
1988:
Rogers JH,
J.Brit.Astron.Assoc. 98, 234-240 (1988).
Minireview, 2001:
Rogers JH, J.Brit.Astron.Assoc.
111 (no.5) p. 245 (2001).
Smith
et al. (1979):
Smith BA et al., Science 204, 951-972 (1979)
First Interim Report: Jupiter in 2003/2004.
Here is a
brief summary of notable features seen on images of Jupiter so far this
apparition, with particular attention to the SEB. Reviewing your
recent images, it is evident that there are actually two SEB features which I
had not clearly distinguished before: the f. end of a mid-SEB
outbreak at L2 ~ 192, and the p. end of a dark reddish spot at L2 ~ 246. All
longitude measurements below are in System II and were made approximately on my
screen; accurate JUPOS measurements will no doubt follow. In addition to
images sent to us directly, I have looked at images by Iga and Einaga, kindly
provided on the ALPO-Japan web site.
The dark reddish spot lies in a moderately broad SEBZ, centred at L2 = 249
(Oct.10 & 15), L2 = 252 (Oct.18). This is presumably a cyclonic barge
(more common in the NEB), in a generally quiet region. It is shown well in
images by Sanchez (Oct.10), Sanchez and Peach (Oct.15), and Ng and
Hatton (Oct.18).
The mid-SEB outbreak had begun during solar conjunction, and was discovered
visually by Horikawa (Sep.17; f. end L2 ~ 192). This is the
first distinct mid-SEB outbreak since 1998, although there have been annual
outbreaks closer to the post-GRS disturbance which were not so
distinctly separate. It consists of a very broad SEBZ, which would probably be
turbulent if viewed at hi-res. Its f. end was shown clearly
in images by Hatton (Sep.21), Peach (Oct.10), and Einaga and Ng (Oct.18) -
always at L2 = 191-194. However it is possible that, as usual with such
events, it consists of a source region where bright white spots arise repeatedly
and prograde at 1-2 deg/day. The Oct.18 images show a very
bright pair of white spots at the f. end of the active SEBZ, which were probably
new. When discovered, the turbulent bright SEBZ of the mid-SEB
outbreak had already merged with the perennial turbulence f. the GRS, as shown
by Horikawa (Sep.26, visual), Iga and Einaga (Oct. 8, images via
ALPO-Japan), and Hatton (Oct.12). Therefore it had begun before mid-September,
but after June 1-3, as it was not shown in images then by
Jason Hatton, Don Parker, and Dave Moore.
Multispectral images by Colville (Oct.13) show a remarkable aspect to the mid-SEB
outbreak. There is a sharp discontinuity at L2 ~ 162, which
appears to be the f.end of the bright spots in visible and I-band, but the f.end
of a very dark SEB in the methane band - as though the turbulent
SEBZ is very dark in methane. The appearance is reminiscent of the South
Equatorial Disturbance in 2000-2001, although this may be misleading. I
suspect that the sector L2 ~ 162-192 also contained bright spots which were not
clearly resolved in visible light but were bright in methane.
These images were of low resolution, with the planet still low, so it will be
interesting to obtain further methane images of these longitudes as
soon as possible, before the mid-SEB outbreak ceases.
Meanwhile the GRS is unusually reddish. This was first indicated by lo-res
images by Iga (Sep.26) and Jacquesson (Sep.27) and confirmed by
much better images by Iga and Einaga (Oct.8) and Hatton (Oct.12). Its longitude
of L2=89 is not significantly different from the pre-conjunction
average of L2=88 in 2003 May.
Images showing the mid-SEB outbreak also show two long-lived anticyclonic white
ovals near the same longitude: Oval BA on the STB (L2 = 223, Sep.21;
212, Oct.18), and white spot Z on the NEBn (a bright bay at L2 ~ 202). As
Damian pointed out, white spot Z is still at the f.end of long-lived barge
B1; they have remained a stable pair for a year.
John Rogers, 2003 Oct.20
Jupiter Section Director,
British Astronomical Association.
&&&&&
PS: To those who provide images:
Thankyou to those of you who have adopted the recommended format for images
(south up) and filenames (2003oct20_name). To those who haven't,
our recommendations are copied below. Even if you have principled
objections to using these exact formats, I do urge you at least to give
the date in the order year-month-day, as 6-figure random numbers are very
confusing!
_________________
"Filenames must be written in the order year-month-day, followed by the
observer's initials; e.g. 2003feb01_abc. Although the IJW database
uses the format abc030201 to encode the initials and date, we prefer to avoid
post-millennial and trans-atlantic confusion by writing the year in
full, and using a 3-letter abbreviation for the month. Please include the
same information in the subject line of your e-mail. You may include
several images from one night in one file. If the file contains a single
image, please include the time (always in UT, and preferably accurate to a
tenth of a minute) in the filename, to facilitate filing in the JUPOS database;
thus, 2003feb01_23305_abc (for an observation on 2003 Feb.1 at
23h 30m 30s UT by observer ABC). Please write all essential data on the image
(not as a separate text file). This should
include the full date and time (UT); CM1, CM2, CM3; your name, and the colour
channel(s) used. If you use different cameras or telescopes, or observe
from different countries during the year, it is useful to have this information
on the image also. Like all amateur recorders, we strongly prefer south up in
images,
as noted above. We recommend that you make the belts horizontal, because
images have to be horizontal if used for montages or maps. Unnecessary
rotations may degrade resolution. The preferred format is a JPEG file of 'high'
quality (not 'maximum', to avoid very large files, but not 'medium' as this may
degrade the image). Please use enough pixels to preserve the full
resolution of the original image."
_____________________
John H. Rogers, Jupiter Section Director.
October 20th, 2003.
Web pages maintained by the BAA Jupiter Section Staff.